物体検出データセット
COCO_2017
取得方法
import zipfile

import tensorflow as tf
from tensorflow import keras

url = "https://github.com/srihari-humbarwadi/datasets/releases/download/v0.1.0/data.zip"
filename = os.path.join(os.getcwd(), "data.zip")
filepath = keras.utils.get_file(filename, url)


with zipfile.ZipFile(filepath, "r") as z_fp:
    z_fp.extractall("./")
読み込み方
import tensorflow_datasets as tfds

🌟
(train_dataset, val_dataset), dataset_info = tfds.load(
    "coco/2017", split=["train", "validation"], with_info=True, data_dir="data"
)
データセットの中身について
print(dataset_info)
#🌟 ざっとこんな感じ
"""出力内容
features=FeaturesDict({
    'image': Image(shape=(None, None, 3), dtype=tf.uint8),
    'image/filename': Text(shape=(), dtype=tf.string),
    'image/id': tf.int64,
    'objects': Sequence({
        # 使い方わからん。。
        'area': tf.int64,
        # 🌟🌟 このクラスは(ymin_r,xmin_r,ymax_r,xmax_r)で格納されてるっぽい
        # 画像のピクセル単位でなく、比率(%)単位
        'bbox': BBoxFeature(shape=(4,), dtype=tf.float32),
        # 使い方わからん。。
        'id': tf.int64,
        # 使い方わからん。。。。
        'is_crowd': tf.bool,
        # 🌟🌟 ClassLabelであることに注目!!
        'label': ClassLabel(shape=(), dtype=tf.int64, num_classes=80),
    })
}),
"""

""" 🌟🌟 datasetinfoからlabelのDecorderが取れる 🌟🌟
"""

int2str = dataset_info.features["objects"]["label"].int2str
[print(int2str(idx)) for idx in adata["objects"]["label"]]
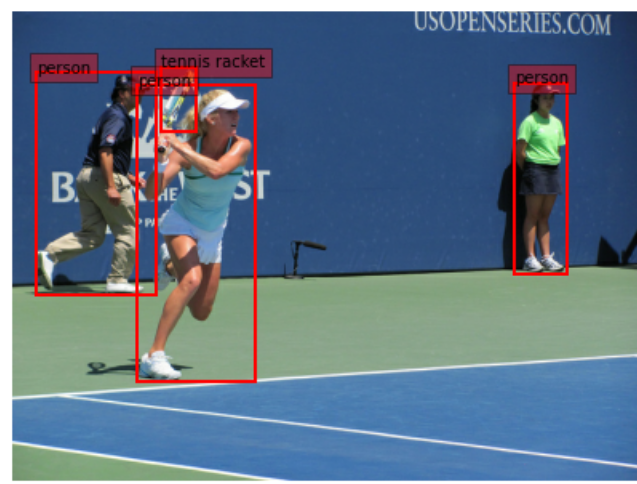
上記より、画像にアノテーション付きで表示する
# Decorder
labelDecorder = dataset_info.features["objects"]["label"].int2str
# Encoder
labelEncorder = dataset_info.features["objects"]["label"].str2int

def dataSetVisualize(data):
    plt.figure(figsize=figsize)
    plt.axis("off")

    # 🌟画像をnp.arrayへ変換
    image = np.array(data["image"], dtype=np.uint8)
    # bboxを画像サイズに戻すため、画像サイズ取得
    yh,xw,ch =data["image"].shape
    plt.imshow(image)
    ax = plt.gca()

    # 🌟画像の高さ、幅をかけることで(元のピクセルの位置に変換する)
    bboxes = data["objects"]["bbox"]*np.array([yh,xw,yh,xw])
    labels = data["objects"]["label"]

    for box, label in zip(bboxes,labels):
        text = "{}".format(labelDecorder(label))
        y1, x1, y2, x2 = box
        w, h = x2 - x1, y2 - y1
        patch = plt.Rectangle(
            [x1, y1], w, h, fill=False, edgecolor="red",
            linewidth="2"
        )
        ax.add_patch(patch)
        ax.text(
            x1,y1,text,
            bbox={
                "facecolor": "red",
                "alpha": 0.4},
            clip_box=ax.clipbox,
            clip_on=True,
        )

for data in train_dataset.shuffle(10).take(2):
    adata = data
    dataSetVisualize(data)
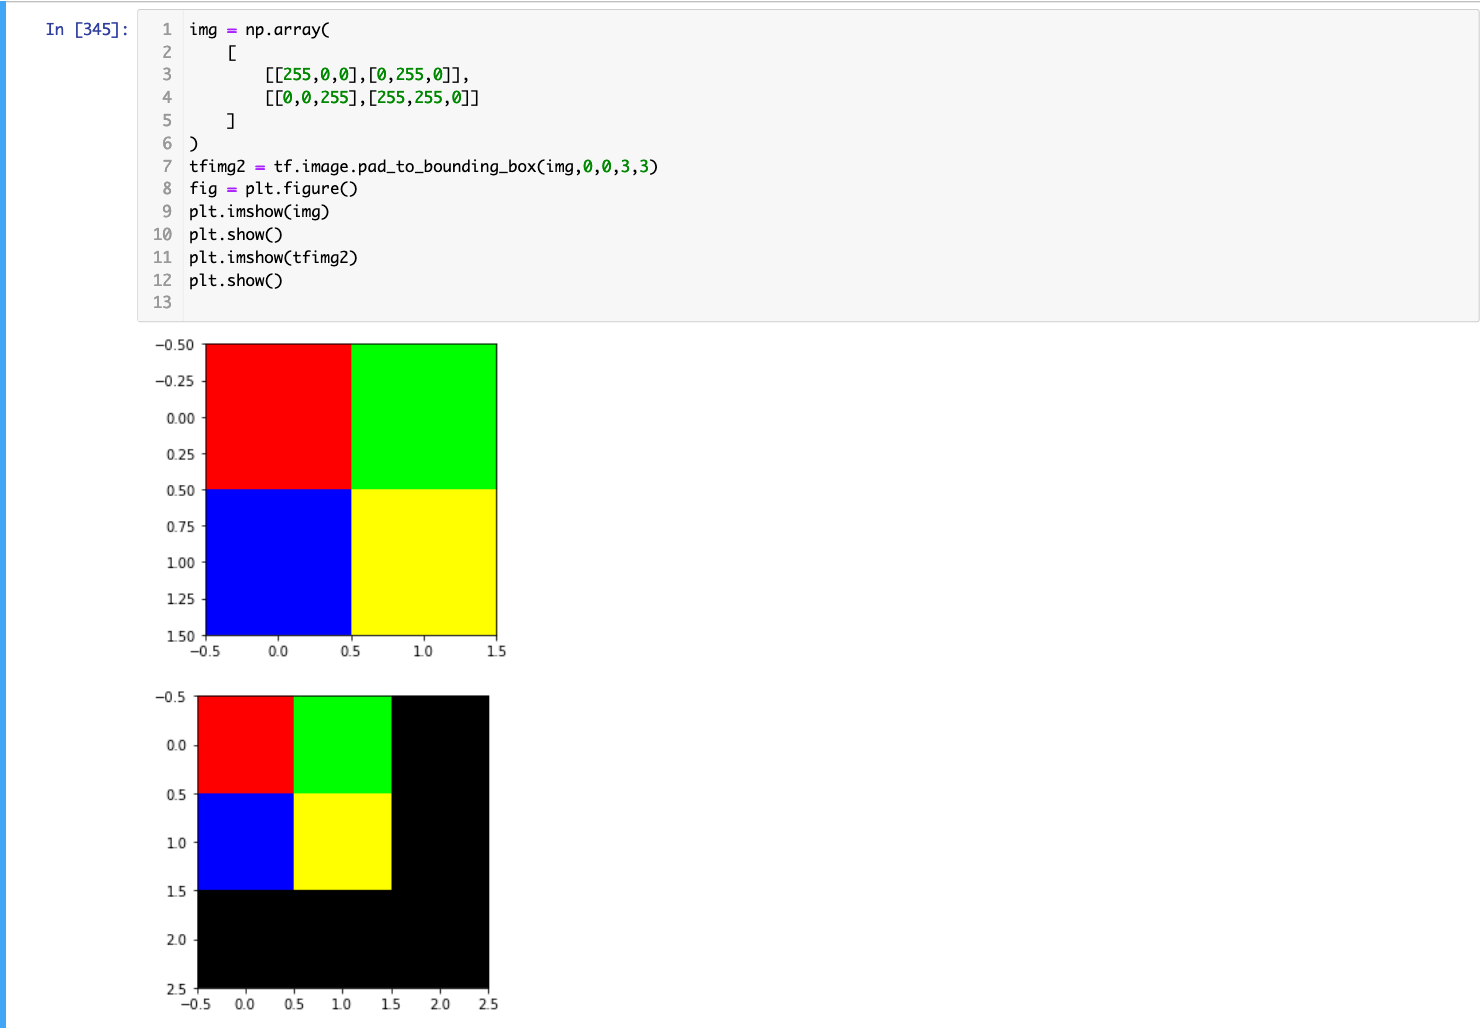
画像をパディングする
- 以下のようにすることで、画像のパディングをおこなうことができる。
第2,3引数を変えることで、埋め込む位置を調整することもできる。
"""
                     Frip(画像を反転)
                     👉
(x1,y1)-------(x2,y1) | (x2,y1)-------(x1,y1)
|                   | | |                   |
|                   | | |                   |
|                   | | |                   |
(x1,y2)-------(x2,y2) | (x2,y2)-------(x1,y2)
                        👇 具体的な座標数字に変換
                      | (1-x2,y1)-------(1-x1,y1)
                      | |                   |
                      | |                   |
                      | |                   |
                      | (1-x2,y2)-------(1-x1,y2)

"""